Examples
Good Plasmons in a Bad Metal
This post recounts a recent demonstration of exceptionally long lived hyperbolic plasmon polaritons (HPPs) in MoOCl2.
What are HPPs? We begin with some definitions. First, a plasmon is a (quantum of a) collective oscillation of electrons, where they slosh back and forth collectively against the fixed positive ions, reminiscent of a ball on a spring. Plasmons can occur at a surface (surface plasmons), where they decay with increasing distance from the metal surface. Second, systems become hyperbolic when, over some range of frequency or photon energy, the sign of the dielectric function ε(ω) along one crystal axes become different from another. (ε(ω) is the quantity that characterizes how the system responds to incident light with photon energy ℏω.) In this unique situation remarkable properties can emerge, for example real-world realization of invisibility cloaks. A material must be strongly anisotropic for this to occur, and usually the hyperbolicity occurs over a small frequency window. (In MoOCl2 the window is quite large, which is one of the many properties that makes it unusual.) Third polaritons can arise when coupling between confined light and matter becomes strong. Usually the light-matter interaction is weak, and the presence of light doesn’t change the quantum states in the material in any essential way, but acts merely acts to scatter electrons from one state to another. When interactions are strong, the light and matter can become entangled and form a new coherent quantum state consisting of both. This can occur if a material is placed in a waveguide or cavity. HPPs are coherent plasmon-photon modes of polaritons, quantized with a defined energy. Thus these resonant modes are quite different from more conventional evanescent surface plasmons. They have strong thickness dependence and can appear at more than one resonant energy.
Normally HPPs very are lossy. This work showed that HPPs are remarkably long lived in MoOCl2: they can propagate for several micrometers, up to about 10 cycles at room temperature—breaking records for HPP lifetimes and rivaling surface plasmons observed in graphene. MoOCl2 is remarkable in other ways as well. Its hyperbolic band spans the near-infrared and visible spectrum, so HPPs can be studied in previously inaccessible frequency regimes.
Still more remarkable is the fact that is MoOCl2 is a “bad metal,” meaning its resistance is very high. This is particularly striking because the high resistance of bad metals usually originates from strong interactions between electrons, which make the mean free electron path (distance an electron travels before scattering) very short. Thus the standard picture of weakly-scattered electron states at the Fermi level, formalized by Fermi-liquid theory and which well characterizes typical metals – breaks down. One marker is that the resistivity increases linearly with temperature. Such phenomena are observed in many kinds of correlated metals, for example high–temperature superconductors. One might expect that the high degree of incoherence (strong scattering) in the electron states would similarly cause collective modes like plasmons to be likewise be short-lived. But strong scattering in the single electron states need not extend to collective modes, and MoOCl2 is a remarkable example. This work interprets the experimental finding using the Quasiparticle self-consistent GW (QSGW) approximation, which is used to explain what makes MoOCl2 special.
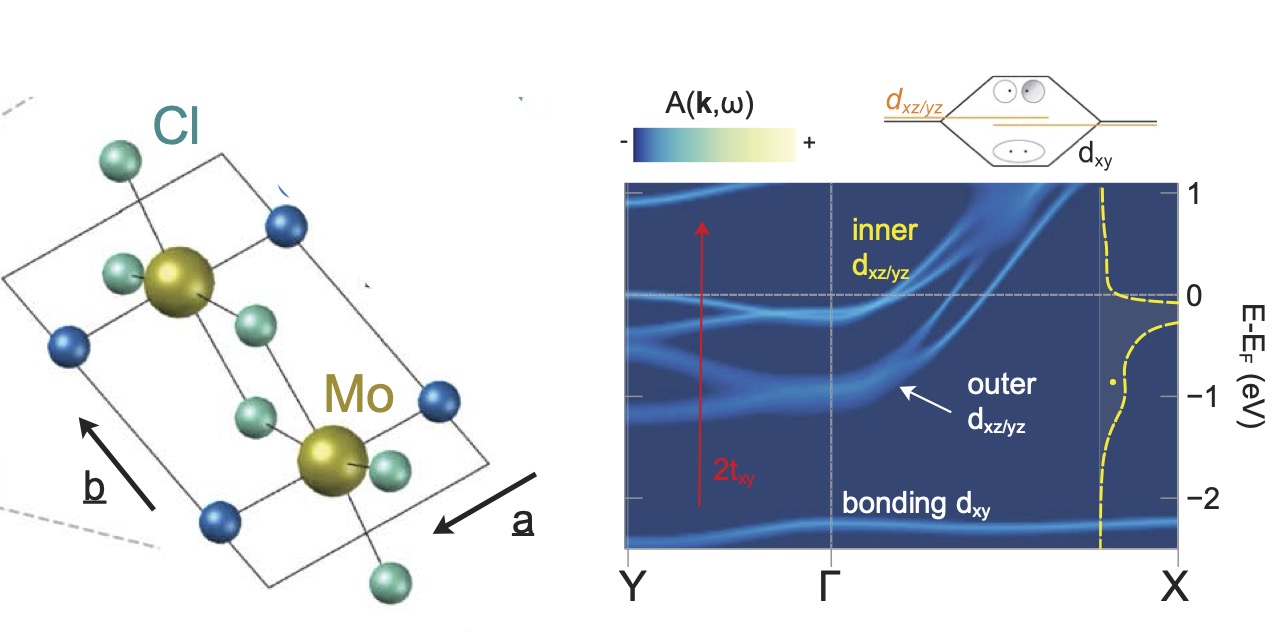
MoOCl2 is a layered system with weak coupling between layers. Fig. 1 shows a cartoon of a single layer with a and b axes labeled. Single layers are stacked along the c axis and bound to each other by weak van der Waals forces. Thus the main action is the a-b plane. At low temperature, Mo dimerize on the chain along b axis (see Fig 1) — rather than Mo being equally spaced they pair into Mo2 units with short, strong bonds, while weakly bonding to other, more distant Mo2 dimers. This occurs through an orbital-selective Peierls distortion mechanism, and makes the system highly anisotropic in the plane and quasi one-dimensional. Mo dxy orbitals couple strongly to the dxy in the dimer counterpart but weakly to everything else, and thus form quasi-molecular bond-antibond pairs. That makes these states are mostly flat, meaning the energy weakly depends on momentum k (see Fig. 1). On the other hand orbitals of dxz/dyz symmetry do couple through the O atoms in the chain. They are dispersive along the chain (b axis) and cross the Fermi level EF, but in a strongly anisotropic manner as the dispersion along the a axis is much weaker.
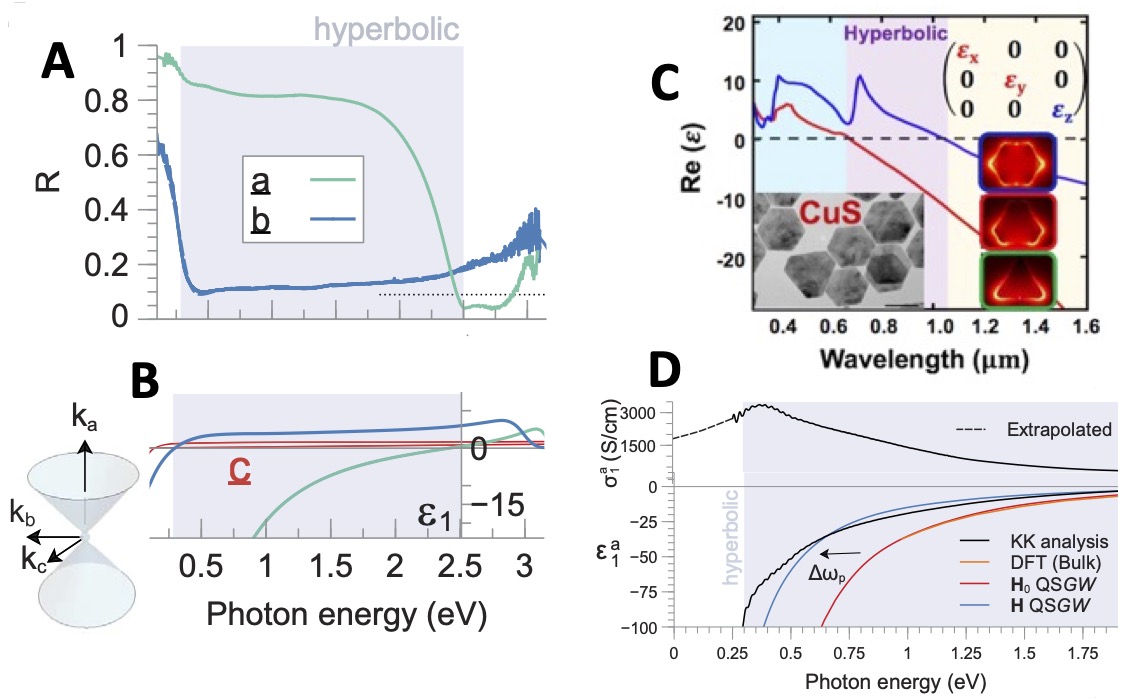
The strong anisotropy in the dispersion causes ε(ω) to become hyperbolic. It is observed to be hyperbolic over a window (0.3, 2.45) eV, where Re εa < 0, Re εb > 0, and Re εc > 0 (Fig 2b). 2.45 eV, where Re εa crosses 0, is the plasma frequency. For comparison Fig. 2c shows Re εa,b in another promising materials system, Copper Sulfide.
Fig 2d compares Re εa(ω) at different levels of theory to the experimental spectrum. In the low-frequency limit the Drude theory predicts that
Re ε(ω→0) ≈ 1 − (ωp/ω)2.
When generated from either DFT or the noninteracting QSGW G0, Re ε(ω) exhibits this functional form; however the theoretical value of ωp is too large. Agreement is much better when Re ε(ω) is calculated from the interacting G. (The distinction between G and G0 is explained in this tutorial.) The RPA bare polarizability G×G, is smaller for the interacting case, because the strength of G is effectively reduced by the Z factor relative to G0. This will be important when HPPs are discussed next.
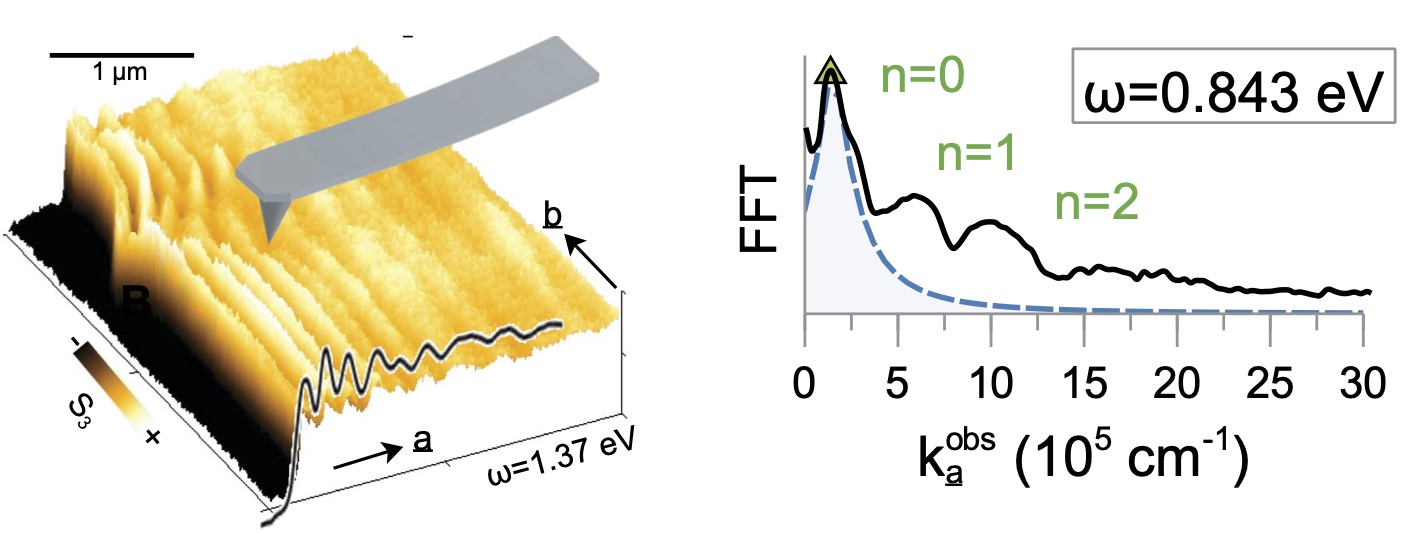
The primary focus of this work is to report on the extraordinarily long lived HPPs. To get them, MoOCl2 must be placed in a waveguide so that the photons and plasmons become entangled and form a coherent quantum state. HPPs are sharply modulated in space, with features smaller than the optical diffraction limit. To read them out, this work used a scattering-type scanning near-field optical microscope (s-SNOM), which consists of a metallic tip illuminated by laser light. The incident light, oriented in a direction k0, launches HPPs with outgoing wave vector k that reflect or transmit at the edge of the crystal. Outcoupled modes will interfere with tip- or edge-scattered light, creating standing wave fringes in real-space scans. This data can be Fourier transformed to get the HPP dispersion relation ka(ω) along the a axis. A simple model was developed for the lowest peak (the subscript a indicates the direction of k; d is the film thickness)
k and ωp are inversely proportional, so a reduction in ωp from the many-body effects discussed above pushes peaks ka(ω) to a higher value than a noninteracting theory would predict.
The quality factor can be obtained simply by counting the number of fringes observed, or from Q = Re k / Im k obtained from a Fourier transform of the SNOM measurement. This expresses the number of propagation cycles before the HPP decays. Q was found to be approximately 10 at room temperature, an order of magnitude higher than the best previously reported value.
We have seen that MoOCl2 is a bad metal, indeed it has lots of incoherence for states within a few tenths of an eV from EF. This is predicted both from QSGW (the fuzziness of the interacting band structure in Fig. 1 is a manifestation of incoherence), and also seen in ARPES measurements (see Fig. 4 and the manuscript). How then does MoOCl2 exhibit such long-lived HPPs?
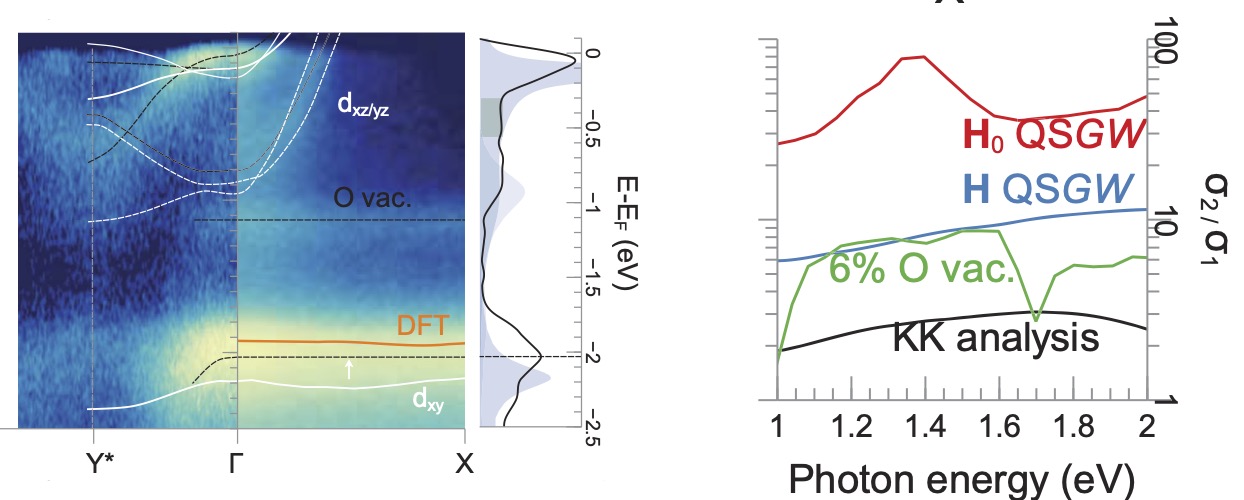
Some insight can be gleaned from the electronic structure. Fig. 4 (left) compares ARPES spectra to the one-particle QSGW band structure; the integrated spectral function is shown in the adjacent panel, where the QSGW spectral function is overlaid on the photoemission spectra. Good agreement is seen (there are some modest differences, explained in the paper.) The faint dispersionless band around −1 eV likely originates from O vacancies. This defect – probably the primary one – was modeled in a QSGW calculation including an O vacancy (6% doping); and it predicts a defect band at around −1 eV where the ARPES band is seen (left panel, Fig. 4). The dielectric response calculated from the theory with this defect shows that it will only mildly degrade Im σ / Re σ (similar to Re ε / Im ε) in the plasmonic region, even with the unrealistically large vacancy concentration of 6% (right panel, Fig. 4).
ARPES also shows a strong intensity at −2 eV, which is the dxy bonding level.
Importantly, this level is positioned well below EF it is because of the orbital-selective Peierls distortion. It pushes interband transitions associated with this state to higher energy and thus avoid substantial overlap with the plasmonic energy range.
Another likely reason is that there is probably an incipient instability to a charge density wave. Experimentally it is observed that the Drude contribution to the conductivity σ is not maximum at ω = 0 (Fig 2d). This is consistent with fluctuating charge density wave (CDW) suppresses low-energy conductivity without fully opening a gap because dynamical fluctuations prevent complete stabilization of charge order. There is also some ARPES evidence for this: a small degree of spectral weight is observed between −0.3 and −0.6 eV missing from the theoretical spectral function (left panel, Fig. 4) The loss in conductivity for small ω is one reason for the observed “bad metal” behavior, but it does not affect plasmons at higher energy.
PAPERS · PLASMONS · CORRELATED METAL