Examples
Electronic structure of CrSBr: theory and experiment
The ability to tune the excitons in two-dimensional (2D) magnetic semiconductor have made them the focus of intense research research in the last decade or so. The CrX3 family stimulated a great deal of early interest because it was a realization of a ferromagnetic 2D semiconductor. More recently CrSBr has received a great deal of attention because it is a unique example of a 2D magnet. It has numerous intriguing magnetic, transport and optical properties that have the potential to underpin novel devices, featuring particularly bright excitons, strong exciton-phonon coupling, exciton-coupled magnons, exciton polaritons, and with indications of strong magneto-electronic coupling that leads to gate-tunable magnetoresistance. However we will defer presentation of optical studies of the optical response function to another post (for example this one), and focus here on the electronic structure which undergirds the optical properties.
CrSBr is a semiconducting A-type layered antiferromagnet with layers weakly coupled by van der Waals interactions. At low temperature spins are ferromagnetically ordered within the plane but planes are stacked antiferromagnetically. CrSBr can be exfoliated to few-layer 2D systems, down even to the monolayer limit. Above the Néel temperature TN = 132 K, it undergoes a transition from the ordered AFM configuration to a paramagnetic (PM) one.
In an early study, QSGW calculations were compared to Angle Resolved Photoemission Spectroscopy (ARPES) measurements performed at high temperature. Very good agreement was found, dramatically improvement agreement to ARPES compared to DFT or DFT+U simulations. One of the important findings of that work was that the fundamental bandgap of CrSBr is in excess of 2 eV, which is considerably larger than experimentally determined gaps of order 1.5 eV. In a more recent work an Oxford group managed to surmount challenging charging issues, which made it possible to perform high-resolution ARPES measurements in both the low-temperature AFM and high-temperature PM phases. QSGŴ calculations were benchmarked against ARPES for both phases. For the PM phase we used Special QuasiRandom Structures, combined with a recently developed Brillouin zone unfolding technique within Questaal, to map the electronic structure of supercells to a small primitive cell.
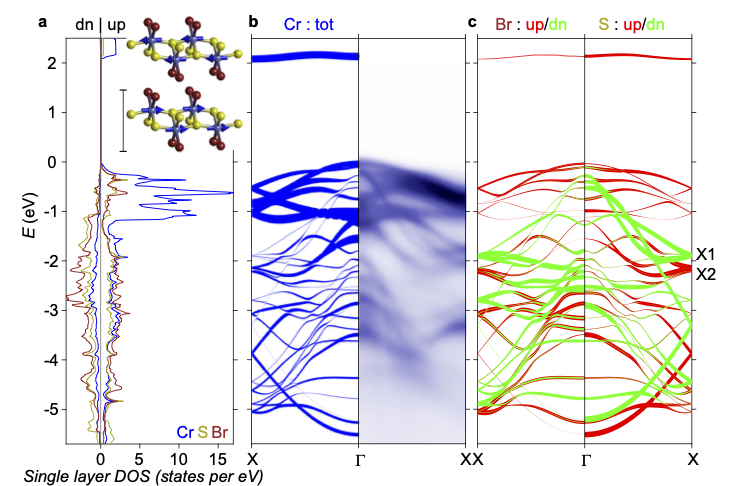
Fig. 1 shows both ARPES and QSGŴ calculations in the PM phase. The agreement between the two is excellent, as seen from the figure. Perhaps the most notable distinction between this phase and the PM one is the splitting at X of two states (labeled X1 and X2) of distinct spin character.
Note also the bandgap is predicted to be 2.09 eV. Experimental determinations of the bandgap is a controversial subject. Tunneling experiments report a gap of ~1.5 eV, while optical absorption and photoacoustic spectroscopy seem to coalesce around a band gap of ~1.2 eV. Both are substantially smaller than QSGŴ predictions. However ARPES measurements at 200 K in this study indicate that the fundamental gap must be at least 0.1 eV larger than 1.8 eV. Calculations and experiments to be described elsewhere show excitonic states with binding energies of 0.6 eV or larger are present, which give an optical response around 1.5 eV. Something similar was found for CrBr3 and CrI3.
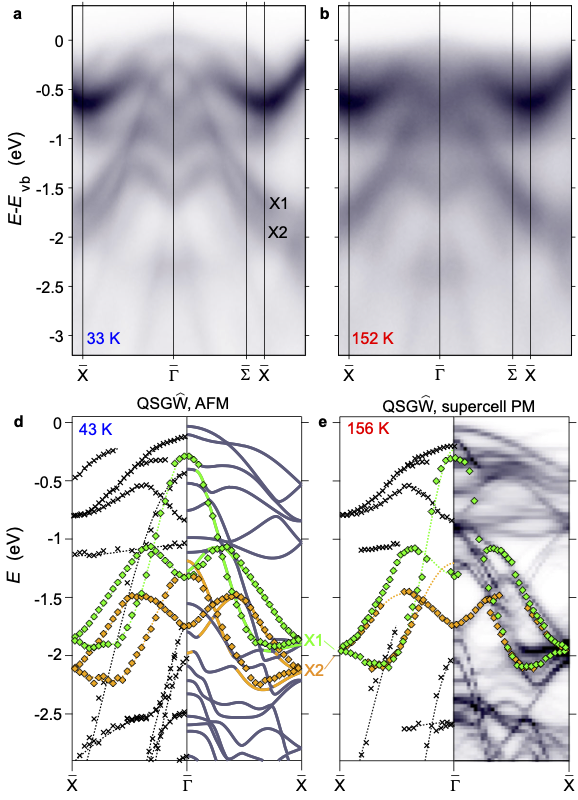
Fig. 2 presents ARPES measurements in the AFM and PM states, and shows how the X1 and X2 states merge. A similar result is found in QSGŴ, showing that the coalescence of X1 and X2 comes from spin disorder. Also the AFM and PM bandgaps are similar in QSGŴ.
PAPERS · SELF-CONSISTENCY · 2D MAGNETS